
WELCOME TO THE SENSMI EDGE
Ingesting telemetry from hundreds of sensors and servers is impressive, but true operational clarity comes from how that data is brought to life. In this edition, we showcase how Sensmi dashboards transform multi-point hardware data into clear, effortless visualisation of customer behaviour and store dynamics. Whether monitoring shelf engagement, regional foot traffic trends, or edge-device health monitoring, our visual ecosystem maps out the entire retail scenario at a glance. Enhanced with purpose-built AI that uncovers deeper, high-impact patterns beneath the surface, Sensmi gives partners, distributors, and retailers worldwide the precision insights needed to move faster and more efficiently!
Mastering Audience Analytics: A Custom Vision Dashboard
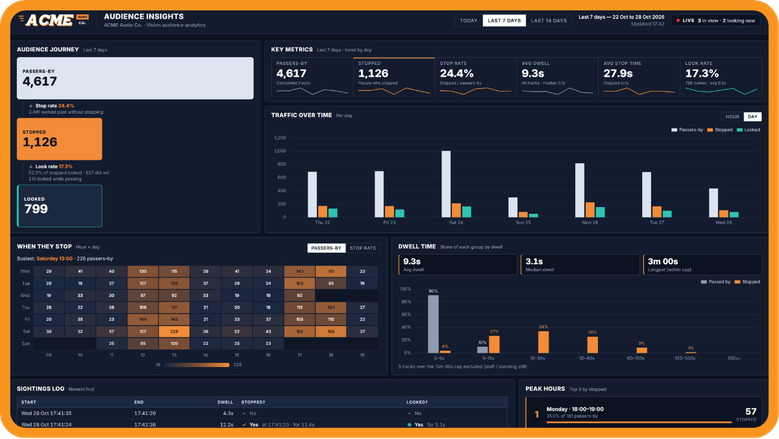
Visualising audience engagement requires a dashboard that is as striking as it is functional. This custom-built interface leverages a sleek dark mode to bring vision audience analytics to life. By elevating the dashboard as the hero of the platform, complex traffic trends become immediately actionable through a beautiful, highly readable layout.
- Visually track the complete audience journey seamlessly from initial passers-by to active lookers using clean, segmented data blocks.
- Identify peak traffic windows instantly with an intuitive, colour-coded “when they stop” heatmap.
- Monitor dwell times and live sightings logs through perfectly aligned, easy-to-read graphical modules.
Transitioning from these visual insights to executive summaries is effortless. With Sensmi’s integrated 1-click AI reporting, you can automatically turn this custom dashboard’s beautiful layout into a presentation-ready strategic view.
Unlocking Shelf Engagement: A Marketplace Lift & Learn Dashboard
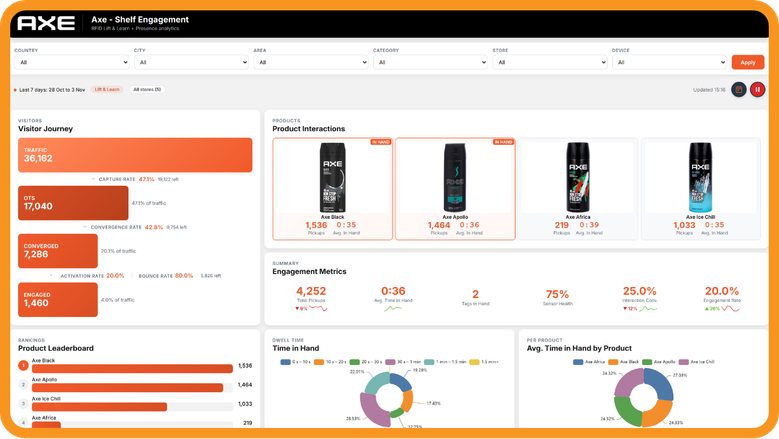
Available directly in the Sensmi dashboard marketplace, this shelf engagement interface proves that premium visual analytics do not require expensive custom development. Designed specifically for RFID Lift & Learn and presence analytics, its bright, airy layout transforms physical interactions into an intuitive visual narrative.
- Follow the complete visitor journey through a beautifully cascading conversion funnel.
- Compare product interactions side-by-side using a striking product leaderboard that makes identifying top-performing variants effortless.
- Analyse engagement metrics and dwell times through crisp, colourful pie charts that provide immediate visual clarity.
By combining these pristine visual layouts with Sensmi’s native 1-click AI reporting, brand managers can instantly generate comprehensive performance reviews straight from these free marketplace template, making the dashboard the true hero of the campaign.
Precision FMCG Tracking: A Marketplace Smart Shelf Dashboard
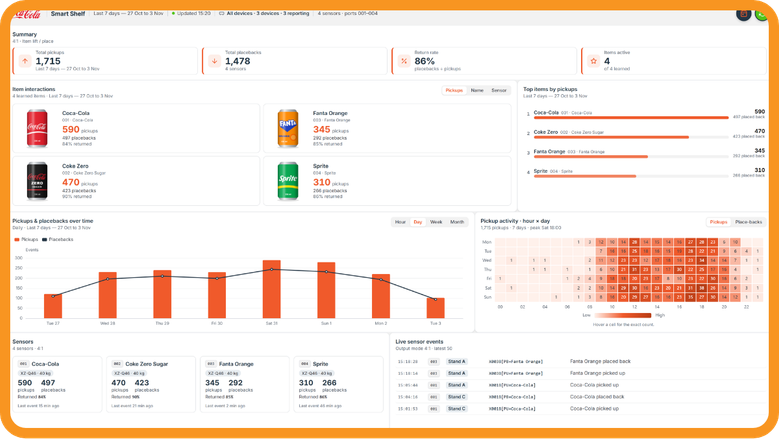
Managing fast-moving consumer goods requires immediate, digestible reporting. This smart shelf dashboard, available in the Sensmi marketplace, provides a pristine, easy-to-read command centre for product telemetry. The interface acts as the hero of the retail space, offering unparalleled visual clarity over shelf performance.
- Monitor exact item interactions through beautifully structured, side-by-side product cards.
- Track consumer return alongside a cleanly formatted live sensor event log for real-time visibility.
- Pinpoint exactly when shoppers interact using an expansive, colour-coded hourly pickup activity heatmap.
When it is time to share these insights, the platform’s integrated 1-click AI reporting transforms these elegant marketplace visualisations into immediate, actionable executive summaries without ever requiring a spreadsheet.
Scaling Regional Intelligence: A Custom Visitor Journey Dashboard
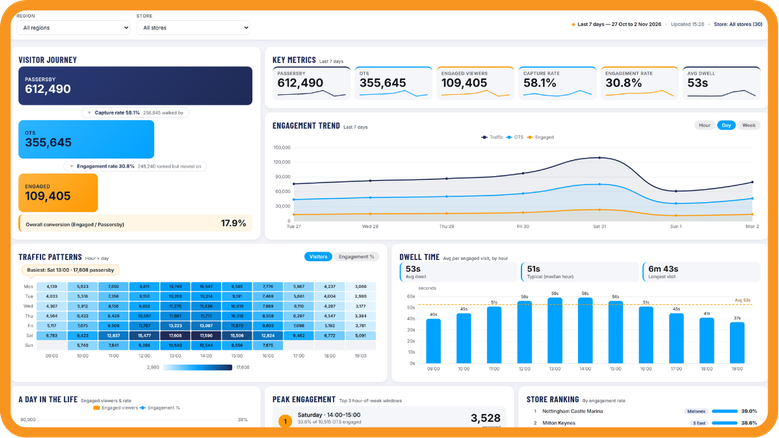
For macro-level analytics, visual clarity is paramount. This custom-built Sensmi dashboard maps out massive traffic volumes through an exquisitely clean, high-impact user interface. By prioritising a beautiful and spacious layout, regional operators can instantly digest complex engagement trends without feeling overwhelmed.
- Visualise massive regional scale effortlessly through a clearly defined top-level conversion funnel.
- Analyse daily engagement trends and traffic patterns via an expansive, heavily colour-coordinated grid that makes spotting peak hours highly intuitive.
- Review store performance through perfectly aligned ranking lists that instantly highlight top locations.
To turn these high-level regional metrics into strategic boardroom presentations, users simply utilise Sensmi’s 1-click AI reporting to seamlessly synthesize the dashboard’s beautiful data into a tailored executive report.
High-Density Retail Security: A Custom Device Wall Dashboard
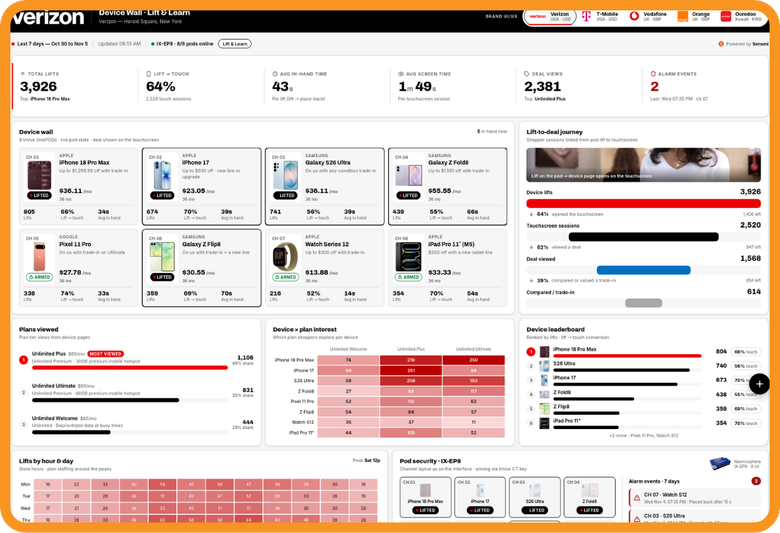
Managing high-value electronics requires tracking both customer engagement and physical security simultaneously. This custom-built device wall dashboard achieves exactly that, packaging dense, multi-layered telemetry into a remarkably beautiful and easy-to-read interface. It stands as the ultimate hero of the smart retail environment, flawlessly merging interactive data with pod security.
- Track specific device performance instantly via highly detailed, yet uncluttered, individual pod status cards.
- Follow the complete lift-to-deal journey through perfectly structured flow metrics, mapping physical lifts to on-screen interactions.
- Monitor customer interest in specific plans alongside clearly flagged, real-time security alarm events.
Despite the complex web of interactions captured on this custom interface, generating strategic takeaways is instantaneous. Operators can rely on Sensmi’s built-in 1-click AI to instantly summarise hardware health and conversion metrics directly from this stunning dashboard.
